
GridTracker Update: Massive SPP Withdrawals, 5% Safe Harbor is Back (Maybe?), and More
Plus Queue Activity Update for the weeks of May 16 -May 29


Executive Summary
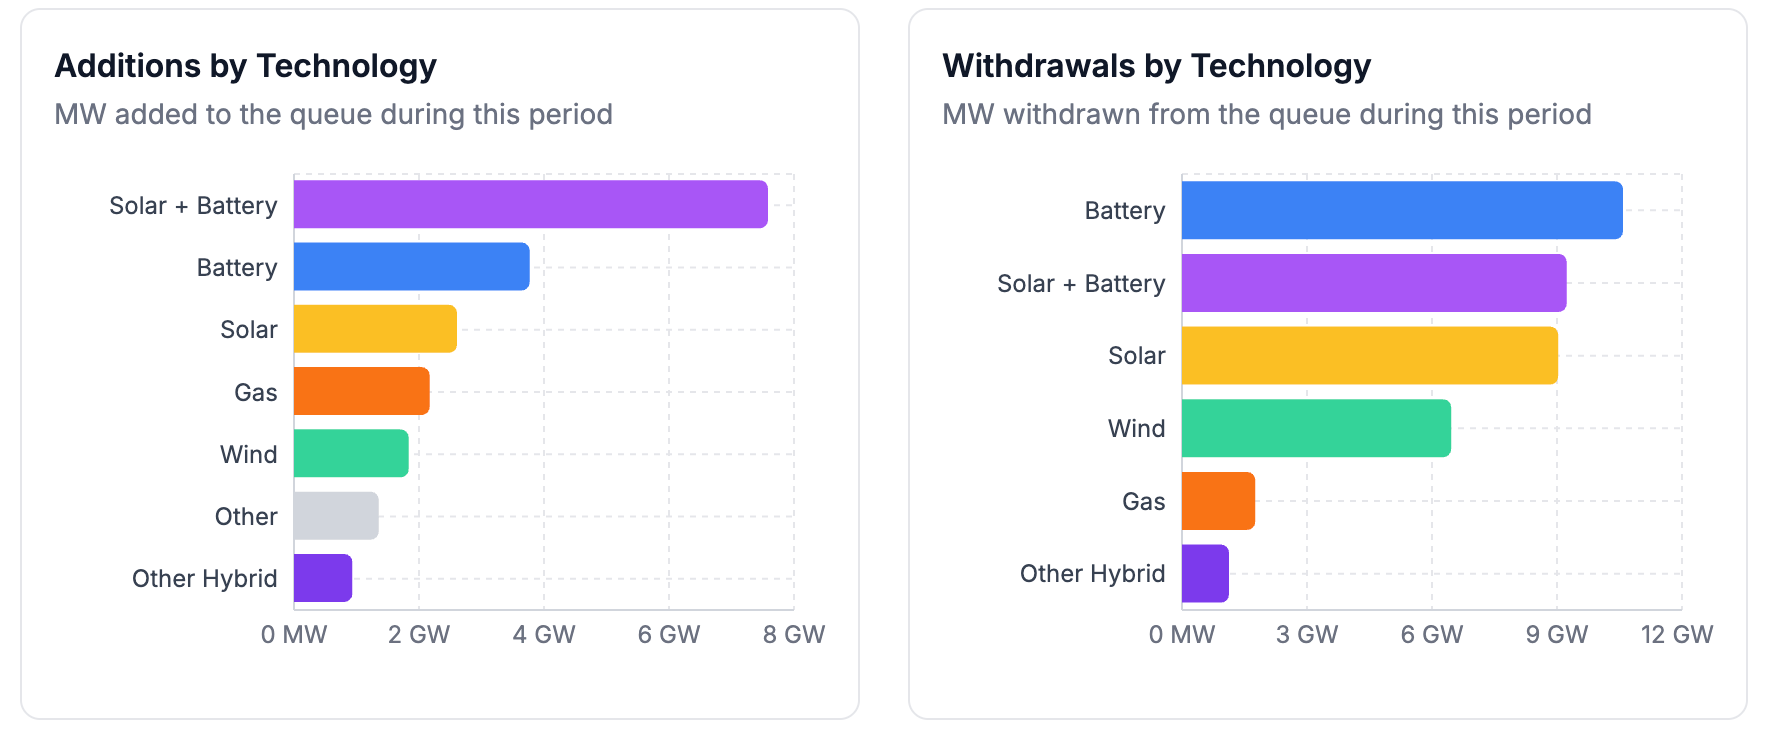
Withdrawals: 38.2 GW (167 projects)
Mostly SPP’s DISIS-2024-001 projects (122 projects, 28.1 GW), which exited the queue after receiving their Phase 1 interconnection cost estimates
Bonneville Power Administration (BPA): 4.4 GW (15 projects) of withdrawals
~1.6 GW (2 projects) from Tucson Electric Power in Arizona
~1.3 GW (5 projects) withdrawn from CAISO
Additions: 20.3 GW (72 projects)
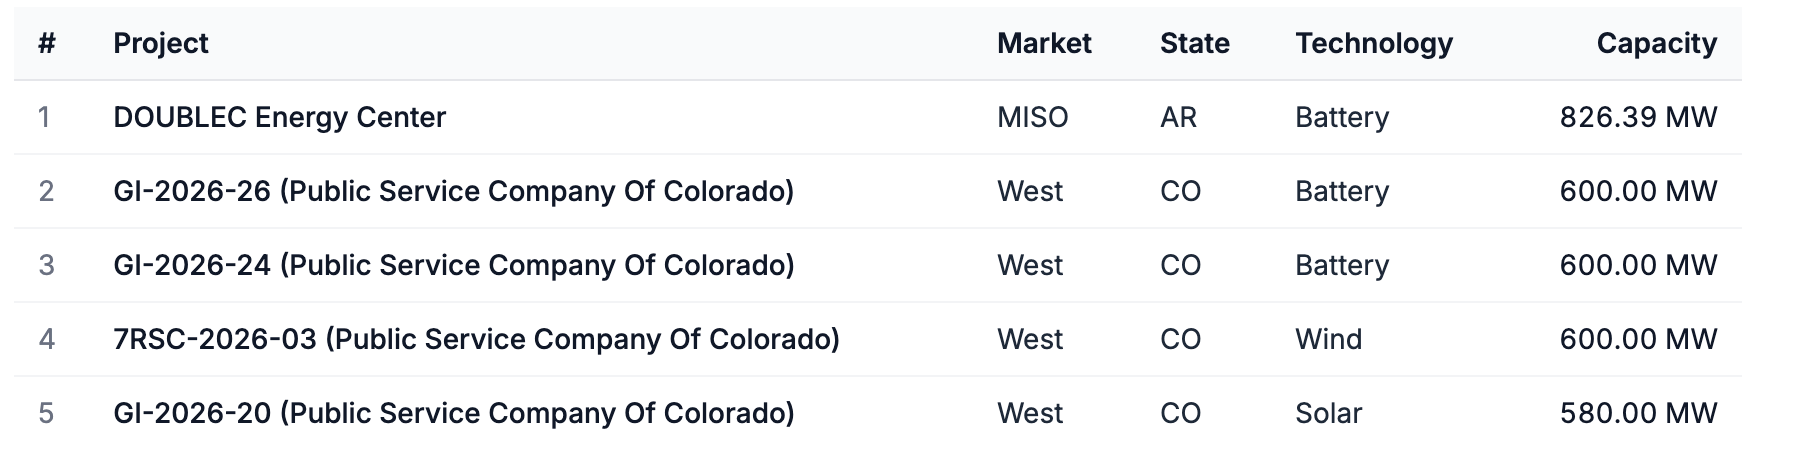
Public Service Company of Colorado (PSCo): 13.3 GW (46 projects)
MISO: 3.9 GW (14 projects)
Southeast: 2.0 GW (10 projects). Solar+storage hybrids led additions (7.6 GW, 23 projects)
In the News
Even NERC can’t make sense of data center load growth: NERC released its 2026 Summer Reliability Assessment last month. The report found that the grid added 58 GW of summer resource capacity, predicted a summer peak demand of 865 GW, and noted difficulty forecasting large-load and data-center interconnections, with their near-term load forecasts revised downward in several regions as those loads come online more slowly than expected.
Rate payers in PJM may already be feeling pain from data centers. PJM’s market monitor reported wholesale power averaged $136.53/MWh in the first three months of 2026, up from $77.78 a year earlier. This roughly 76% jump is a symptom of rising demand from data centers and other customers in the region.
Coal gets another boost. On June 4, DOE announced $850 million in funding to support the coal sector, including up to $425 million in Defense Production Act funds to modernize more than a dozen existing facilities alongside a separate $350 million tranche backing four projects, among them two new plants in Anchorage, Alaska (1.25 GW) and Mt. Storm, West Virginia (1.6 GW). These would be the first new U.S. coal plants to come online since 2013.
The 5% safe harbor is back, for now. A federal court vacated IRS Notice 2025-42, restoring the safe harbor as a way for wind and solar to projects greater than 1.5 MW to establish beginning of construction under the 45Y and 48E credits, less than a month before the July 4 deadline. The court found that the Treasury never adequately explained the change and unfairly singled out wind and solar, though the ruling could still be appealed.
Worth a Read
CAISO published its revised 2025-2026 Transmission Plan last month.
Interested in nuclear? This deep dive on Diablo Canyon economics from UCSB is well worth a read.
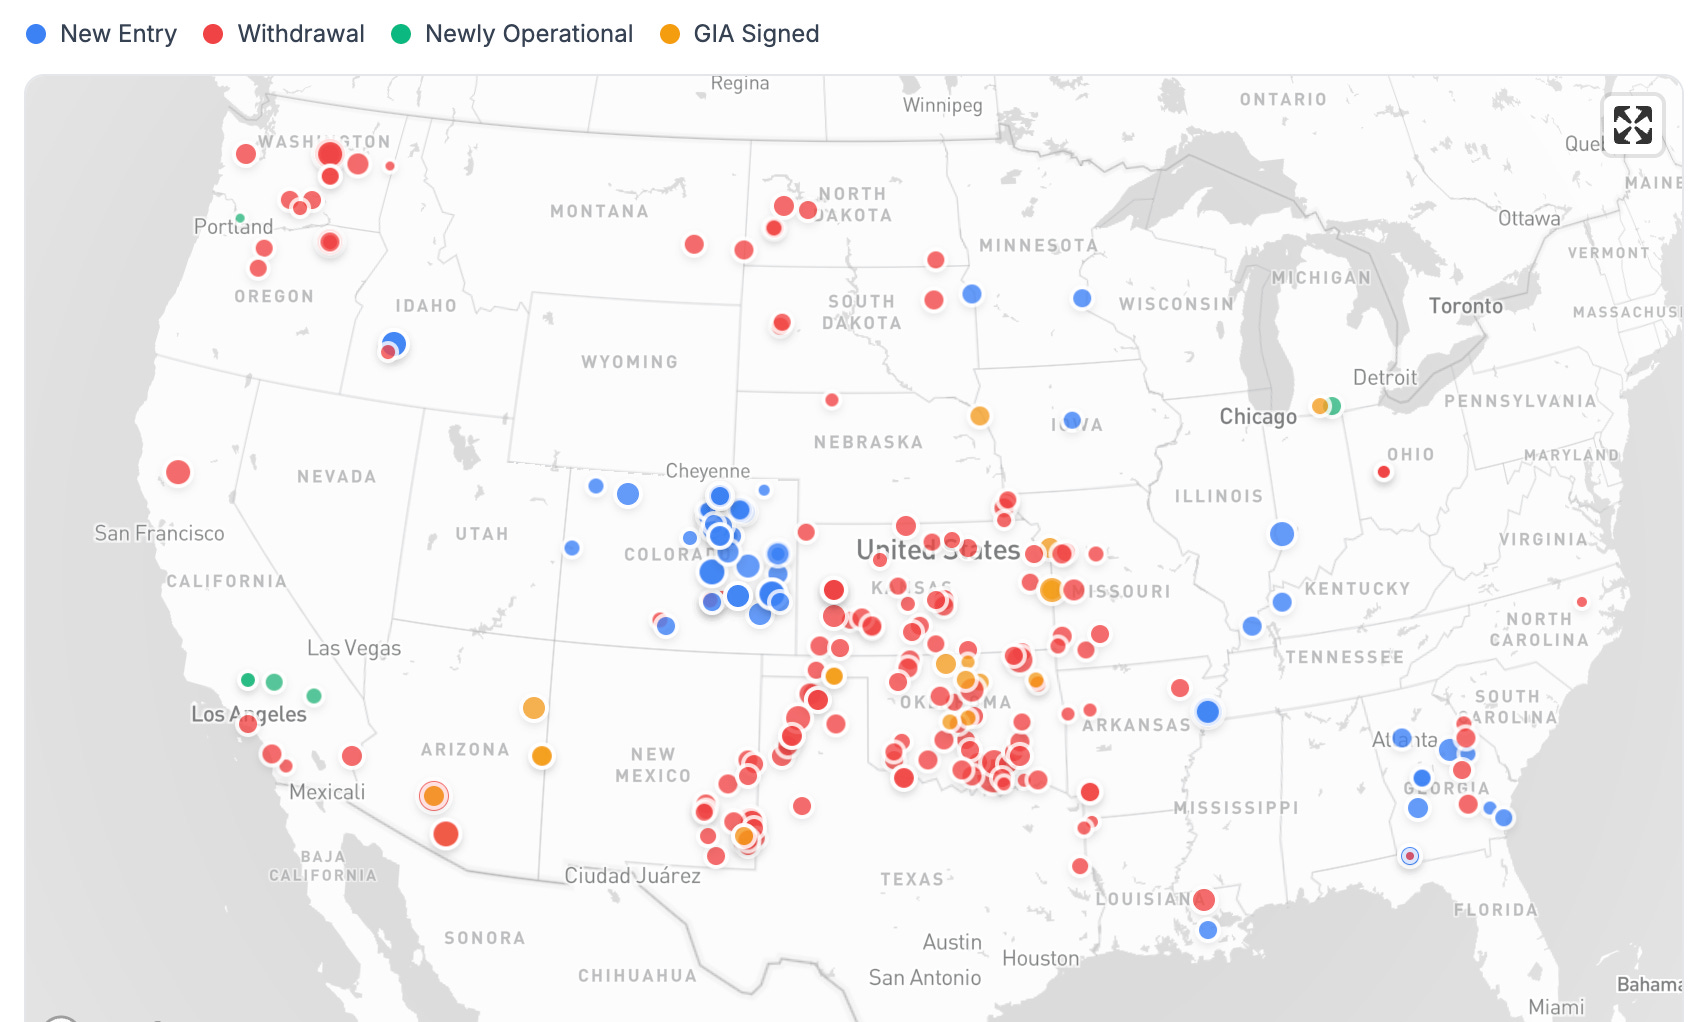
Where’s the Activity?
Three queue activities stand out, each covered in more detail below: SPP's DISIS-2024-001 cluster withdrawals in the central US, BPA's withdrawals in the Pacific Northwest, and PSCo's new requests in eastern Colorado.
Activity at a Glance
Withdrawals are the story this period: 38.2 GW exited the queues (up 737.5%) while new entries slowed to 20.3 GW (down 45.1%). Both dynamics are mostly a matter of major cluster updates being published. Beyond the headline flows, GIA signings ticked up (21 projects, 4.8 GW, +15.3%), while the newly operational and suspended tallies are too small to read much into.
Regional Breakdown
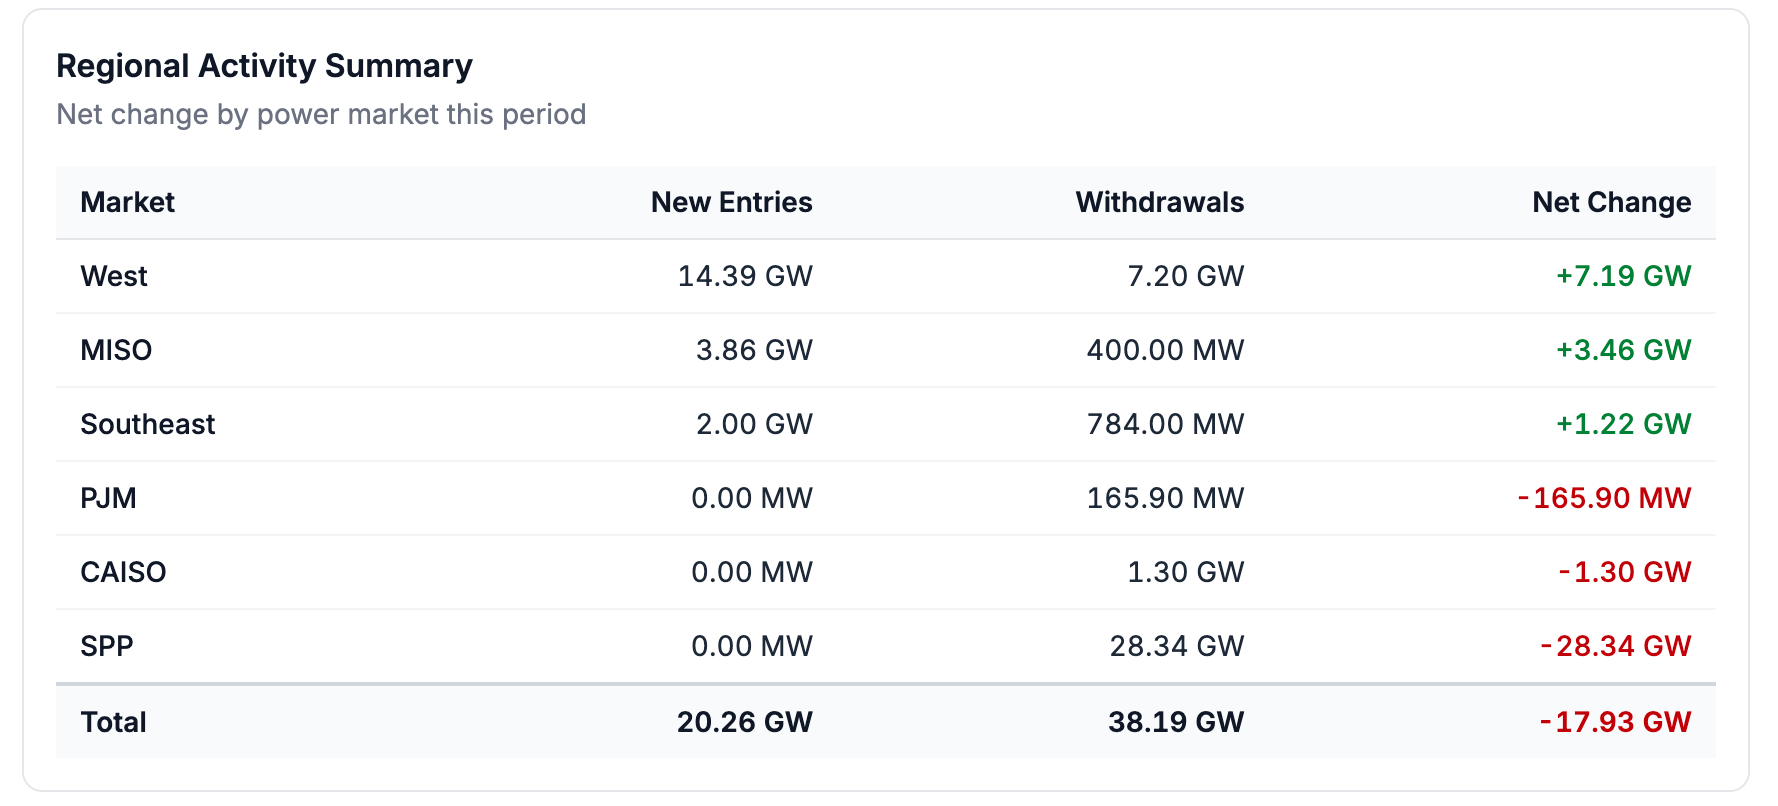
Net of new entries and withdrawals, most markets experienced only modest changes to their queues: the West added 7.2 GW from the PSCo entries, MISO and the Southeast posted smaller net gains (+3.5 GW and +1.2 GW, respectively), and CAISO and PJM saw minor net declines (−1.3 GW and −0.2 GW). SPP experienced a net −28.3 GW swing that accounts for essentially all of the period’s contraction.
GridTracker subscribers will have seen our March report on the Phase 1 study results for SPP’s DISIS-2024-001 cluster. As we saw in that report, DISIS-2024-001 is the largest interconnection cluster in SPP history, with more than 250 projects and 66.5 GW seeking interconnection. The Phase 1 study process allocated $30.2 billion in network upgrade costs, with a median project cost of $408/kW. In that report we flagged that many of these projects sat in the path of newly planned 765 kV transmission lines and had been assigned massive upgrade costs to help fund them, and that heavy attrition was likely. After Phase 1 results were posted, they had 15 business days to advance into the next study phase or withdraw. SPP has now updated its queue to reflect those decisions.
The post-Phase 1 decisions played out as we predicted. Attrition was substantial and clearly driven by costs. Nearly half the cluster’s projects (122, totaling 28.1 GW) withdrew. As we predicted in our March report, the withdrawn projects were largely those which faced the highest upgrade costs. Withdrawn projects had a median allocated cost of $655/kW versus $244/kW for those that stayed. 72% of the withdrawn cohort had allocated costs above the $408/kW median identified in our Phase 1 analysis, compared to just 26% of those that remained. Of the cluster’s $30.2 billion in allocated costs, roughly $19.3 billion, about two-thirds, was allocated to projects that have now exited.
Those costs are overwhelmingly shared network upgrade costs rather than POI costs. 91% of the withdrawn projects’ allocated costs were for network upgrades and only 9% for POI facilities. The largest of those network costs trace to a single 765 kV corridor: the Minco, Phantom, and Woodward EHV ties into Crawfish Draw are the biggest line items in the withdrawn cohort, each allocated between $600 and $700 million across roughly 30 of the withdrawn projects. The Southeast study region shed the most capacity (42 projects, 10 GW) but at a moderate $431/kW median, while the Southwest and Central study regions carried the highest median upgrade costs among the withdrawn ($980/kW and $923/kW, respectively) and the two largest total cost burdens ($6.9 billion and $6.1 billion).
The DISIS-2024-001 cluster was almost entirely composed of projects seeking full-deliverability: 241 of 251 active projects requested NRIS service, requiring study for full network deliverability. Within the set of NRIS projects, the projects that withdrew faced a $655/kW median against $262/kW for those that stayed. However we cut the data, the result is the same: upgrade costs are what separated the projects that withdrew from the ones that stayed in the queue.
Outside SPP, two regional stories played out. BPA posted 4.4 GW of withdrawals across 15 projects in Washington and Oregon, all of it renewables and storage. Storage and storage hybrids made up the bulk, led by a single 1 GW battery exit, with wind accounting for most of the rest. PSCo’s new requests cut the other way: 13.3 GW of additions across 46 projects, overwhelmingly solar and storage. Solar+battery hybrids led at 5.3 GW, with standalone solar and battery close behind (about 2.4 GW each) and wind adding another 1.8 GW.
Notable Projects/Trends
A few individual projects worth flagging. Counter to the broader pattern we've observed recently, where renewables and storage made up the bulk of withdrawn capacity, the single largest project to withdraw was a 1.3 GW gas plant in SPP (Oklahoma Gas and Electric). In terms of additions, the standout is the Double C Energy Center, a roughly 1.25 GW Entergy Arkansas development in Crittenden County, AR, that includes an 826 MW solar+battery facility and a 421 MW battery facility. The development is located near Google's $4 billion West Memphis data center, announced in October 2025 and powered by Entergy. It interconnects directly into the West Memphis 500 kV line. It's an early, concrete example of hyperscaler energy procurement showing up in the generator interconnection queue. That’s something we expect to see more of, and will continue to track, as data center buildouts accelerate. On the operational side, little came online. The largest was a 200 MW solar project in MISO (Michigan), alongside four smaller storage and solar+storage projects in CAISO from Southern California Edison.
GridTracker users get access to:
Project-level insights (see the project-level changes that occur in real-time)
Exportable datasets (export the full list of newly operational, withdrawn, GIA-signed, and added projects)
Interactive graphs and visualizations
Custom dashboards with real-time alerts and data export
… and much more!
 | A guest post by
|
 | A guest post by
|
@steven - it could just be me but I don't see this "bostonclimate.com" to be active.